Stories from Satellite Data
Satellite data, field evidence, and hydrological science — working together to answer real questions about real landscapes.
What's happening to water bodies in your region? Where is forest being lost? Where should you focus? These demonstrations show how satellite data answers those questions in practice — Lake Urema's seasonal transformations, Mount Gorongosa's forest loss, Chicamba Dam's pollution crisis, and irrigation networks in Montepuez mapped through combined remote sensing and field work.
FLID Mapping Visualisations
Methodological Innovation & Training
Explore interactive demonstrations of smallholder irrigation mapping methodologies. Visualisations show how satellite composite length, algorithm selection, and training data composition affect detection accuracy: essential learning for irrigation assessment in data-scarce contexts.
Why it matters: Irrigation mapping accuracy depends heavily on which algorithm you use and how you build your training data. This tool lets you explore those tradeoffs directly — useful for anyone designing a remote sensing workflow in a data-scarce environment.
SmartCane.Ag - Crop Intelligence
Sugarcane Crop Monitoring & Yield Prediction
Saterra Labs provides geospatial expertise to SmartCane.Ag, enabling satellite-based crop monitoring, phenology tracking, and yield prediction. We combine remote sensing analysis with agronomic modelling to help growers optimise crop management decisions.
Our contribution: We deliver satellite-based crop intelligence including vegetation monitoring, water stress detection, and phenological tracking. Our analysis helps growers identify management opportunities, optimise input application, and predict yields before harvest: turning raw satellite data into actionable farm-level insights.
Lake Urema Water Dynamics
Gorongosa National Park, Mozambique
Lake Urema is a tropical lowland lake-floodplain system experiencing dramatic seasonal variations. This viewer tracks changes through 84 satellite observations (2017-2023), revealing critical insights about water storage, groundwater contribution, and ecosystem response to climatic variability.
Why it matters: Lake Urema provides essential ecosystem services including water storage, flood attenuation, and wildlife habitat. Understanding its hydrology is crucial for managing the impacts of deforestation on Mount Gorongosa, which feeds rivers sustaining the lake during dry seasons. Research shows a precipitation response time of about two months, indicating significant groundwater contributions.
Forest Cover Monitoring
Mount Gorongosa, Mozambique
Monitor deforestation patterns on Mount Gorongosa, one of central Mozambique's few true rainforest systems. This dashboard tracks forest loss driven by slash-and-burn agriculture, charcoal production, and population pressure.
Critical ecosystem: Mount Gorongosa functions as a vital water tower, containing endemic species and feeding rivers that sustain downstream wildlife and agriculture. Approximately 40% of original forest cover has been lost since the 1970s (13,500 ha to 8,300 ha by 2019), with current losses averaging 350 ha/year. Restoration efforts through shade-grown coffee are helping reconnect fragmented forests.
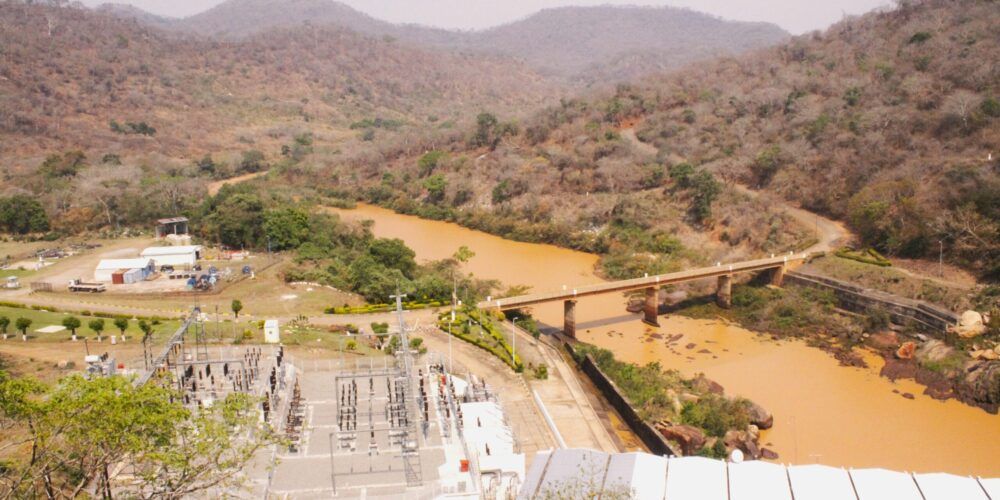
Chicamba Dam Degradation
Manica Province, Mozambique
Document severe environmental degradation from artisanal gold mining near Chicamba Dam through annual RGB composites (2017-2024). Visible changes show water pollution, sedimentation, and land cover impacts.
Crisis documented: Mercury levels up to 16x legal limits. Mining waste has turned rivers muddy and reddish, destroying aquatic life and rendering water unsafe. Accumulated sludge cut hydroelectric production by 50%. The dam supplies drinking water to Chimoio and thousands of residents, making this pollution a critical public health threat.
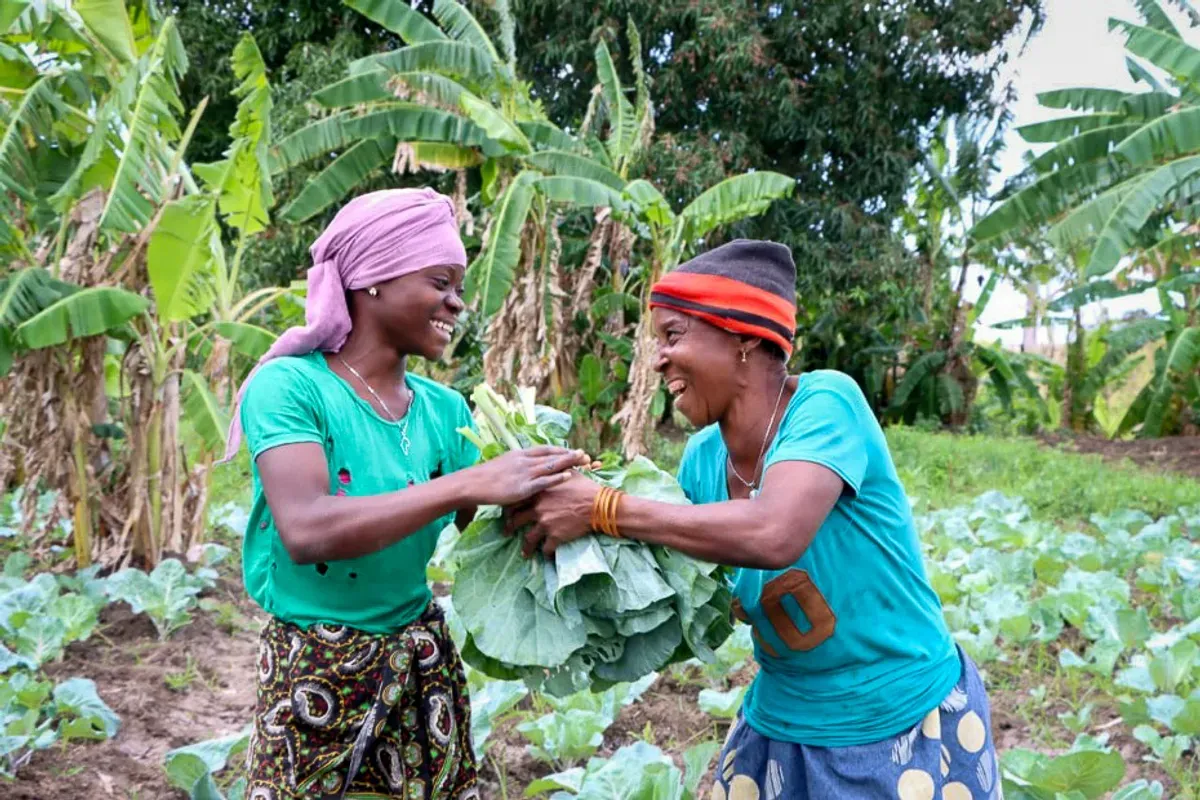
AgroVida Farmer Assessment
Montepuez, Cabo Delgado, Mozambique
Interactive map documenting smallholder irrigation assessment for AgroVida program. GPS-tagged field photographs show irrigation infrastructure, water sources, and farmer practices across Montepuez district (October 2025).
Development context: AgroVida aims to strengthen food systems through farmer-led irrigation development (FLID). Remote sensing identified potential irrigation hubs, guiding field missions to 22 farmers across multiple communities. This demonstrates our approach of combining satellite analysis with ground-truthing to catalyze sustainable irrigation expansion targeting 50ha of improved irrigated agriculture.